9/11/2014
DC Speed Cameras Have Not Improved Traffic SafetyAccident rates have not improved in Washington, DC after issuing $500 million in speed and red light camera tickets.

Washington, DC has been using speed cameras for more than a decade, but traffic safety has not improved. The city's private vendors have mailed more than 7 million photo tickets and collected a half-billion dollars in revenue, injury accidents have not declined as they have throughout the rest of the country.
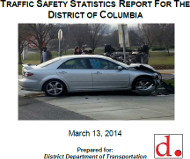
According to an analysis released in March by Howard University's Transportation Safety Data Center, there were 18,428 collisions in the city in 2012. Of these, 18 were fatal and 5258 involved injuries. Many of the photo radar units are stationed at high volume locations that are among the city's safest roads. The District has, for instance, speed cameras on Interstates 295 and 395, even though only 87 of those 18,428 collisions happened on an interstate, none of which proved fatal.
The city's focus on speed enforcement does not match the District Department of Transportation's own statistics which show speed was a factor in only 3.1 percent of accidents. Red light cameras are also stationed throughout the city, even though red light running caused 2 percent of accidents, and right turns are red were implicated in 0.08 percent of collisions. At most the use of speed cameras could have an impact of 3 percent on the accident rate and red light cameras a 2 percent difference.
Driver inattention, on the other hand, was the most frequent cause of a fender bender at 16.1 percent of incidents. The use of a cell phone, being distracted by passengers, interacting with loose cargo, reading behind the wheel (or by a pedestrian), interacting with a pet and personal grooming were all examples of common causes of an accident. Three collisions were caused while drivers or pedestrians were writing on a piece of paper.
Nationally, accidents, injuries and fatalities have been on a steady decline. Between 2008 and 2012, the injury rate per mile traveled dropped 15 percent in the United States. The injury rate is 150 percent higher in the District, and the rate did not drop at all between 2005 and 2011 -- a steady 203 incidents per 100 million vehicle miles traveled (compared to 75 nationally). Washington only beat the national average in fatal accidents.
With streets frequently gridlocked in the nation's capital, the most common types of accident are sideswipes followed closely by rear enders. The majority of incidents happen on a clear, sunny day during medium to heavy traffic. About 5 percent of accidents involve a pedestrian and 3.5 percent a bicyclist. Drivers holding DC licenses are involved in 37 percent of accidents, Marylanders 33 percent and Virginians 13.8 percent.
A copy of the report is available in a 4mb PDF file at the source link below.


